4. Users
4.1. The Left Panel
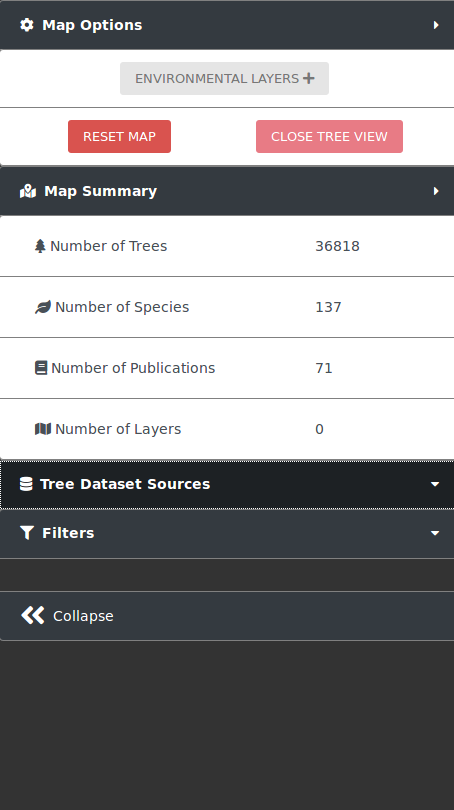
The action panel to interact with the map and trees is located to the left of the screen. At the top lies the button to expand the panel to show the environmental layers panel. After that there are two buttons: the RESET MAP button, which resets the map to its original state on load and the CLOSE TREE VIEW button, which closes the tree view that is opened when a tree is clicked. The section after that shows the map summary, which has statistics for the data selected and shown on the map. At the bottom of the left panel is a collapse button, which hides the majority of the action panel increasing the size of the map.
4.2. Select dataset sources to include
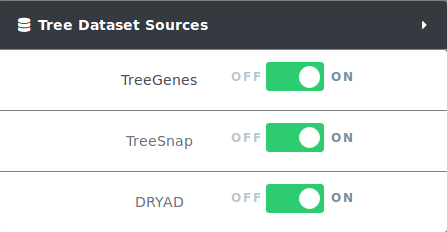
CartograTree enables the analysis of trees from three data sources: TreeGenes, TreeSnap, and DataDryad. The user can choose which trees from which datasets they want on the map, or any combination of them. When applying filters only trees from selected datasets are effected.
To contribute and submit your own data for TreeGenes, you can use TPPS: https://treegenesdb.org/tpps. This is a module that streamlines the submission process for plant related studies. The documentation for TPPS can be found here: https://tpps.readthedocs.io/
You can also contribute to TreeSnap by downloading the app and submitting pictures of the trees that you find: https://treesnap.org/.
4.3. Select and filter trees
Users can select from the left pane the trees to be included in an analysis. CartograTree has tens of thousands of trees, and it will only continue to grow. To only look at the trees of interest to you, you can filter the trees on the map by taxonomy, publication, genotype, and/or phenotype.
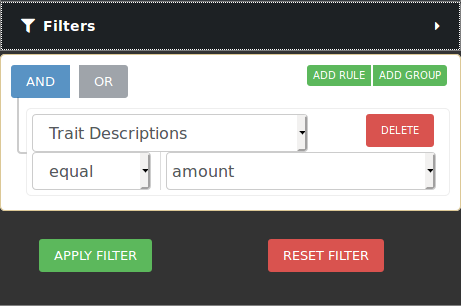
If you want to narrow your search even more, you can make use of the combination filters offered by making use of the AND/OR switches and the ADD RULE and ADD GROUP buttons. Resetting the filter removes all the currently active filters and shows all trees available on the map again.
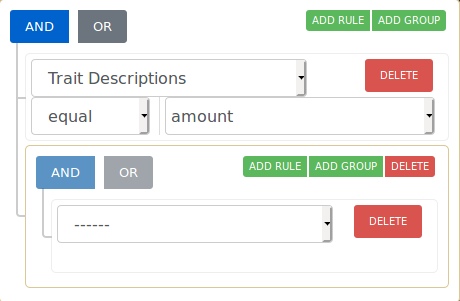
The operation that is currently selected for each group is colored blue. The selection condition available for each property is EQUAL and NOT EQUAL. After clicking Apply Filters, the map should move to the area of interest where the filtered trees are located.
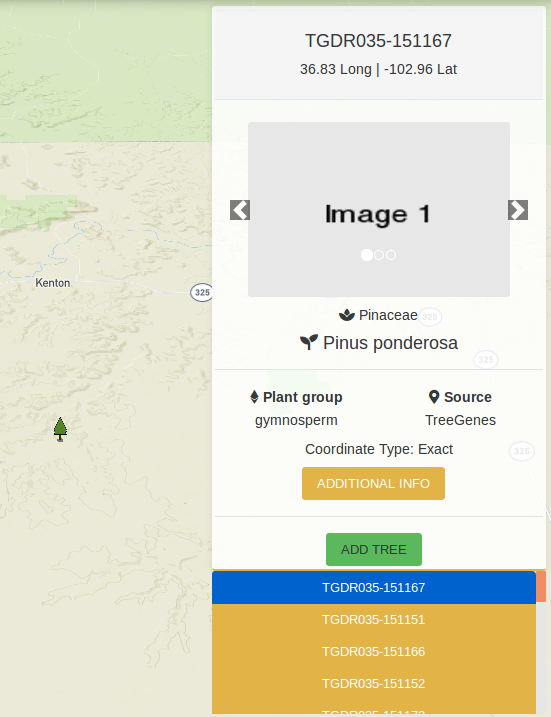
Hovering over a tree icon reveals how many trees there are at that location. Clicking on a tree icon opens a map overlay located at the top right of the map. This map overlay shows information about the currently selected tree and any images that are present for that tree. Clicking on the ADDITIONAL INFO button creates a popup which shows the publication, markers and phenotypes recorded for the tree. At the bottom is a list of the trees located at this area. You can click on any of the tree IDs on the list to view information for that tree. There is also an ADD TREE button which puts the tree in the list of trees that will be part of the analysis.
4.3.1. Filtering by passing parameters to URL
You can also filter the trees on load of the map by adding additional parameters to the URL. The base URL for CartograTree is: https://treegenesdb.org/cartogratree If a valid session has been provided then the URL is: https://treegenesdb.org/cartogratree?session_id=<session_id>
The additional parameters that you can pass include TGDR study accession, species, genus, and family. Passing multiple of these parameters will result in a conjunction of the options. An example filter by passing URL arguments is: https://treegenesdb.org/cartogratree?accession=TGDR002 https://treegenesdb.org/cartogratree?species=Abies%20alba
4.4. Select environmental data
Users can also select from the left pane, the environmental values to be included in an analysis, by turning environmental layers on or off. The environmental layers are layered on top of each other, with the latest layer placed on top of previously selected layers. Clicking on any random point on the map with at least one active layer will show the environmental values for that location.
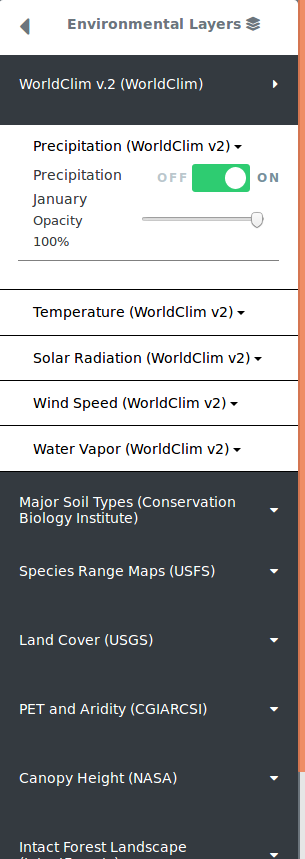
Some enviornmental layers contain additional filters which will also be seen under the on/off toggle button. For example, range maps may have color options that allow you to color each range map with a different color as a way to differentiate between multiple selected layers. Some environmental layers contain a year range slider filter which allows you to filter between a starting year and ending year. For those that can filter by year, you will see a range slider in which the left select represents the starting year and while the right select represents the ending year. Adjusting these filters will filter the data in realtime.
4.5. Get location information
Users can display the values at a particular location on the map, by clicking on the map at that location. The pop-up window, will display the trees present at that location (if there are any), and the values from the environmental layers selected.
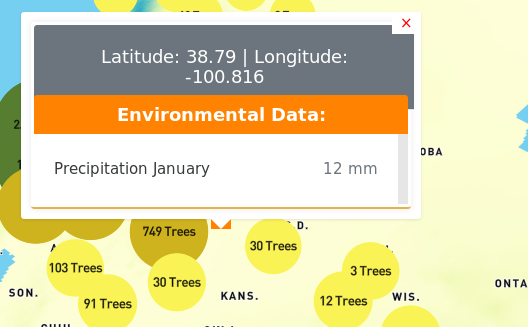
At zoomed out levels the trees are clustered and are represented by circles. The color and size of the circle indicates how many trees there are in the cluster. The user can click on a cluster to zoom in and view the individual trees.
4.7. Saving and loading saved searches and config
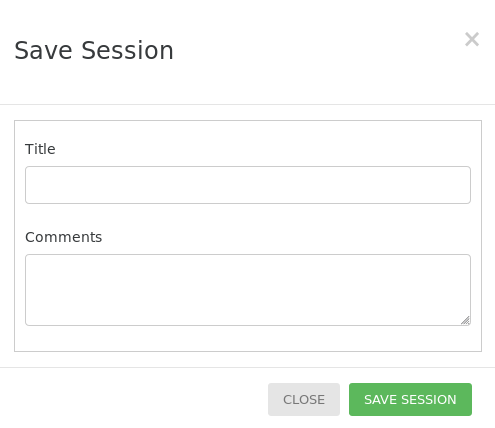
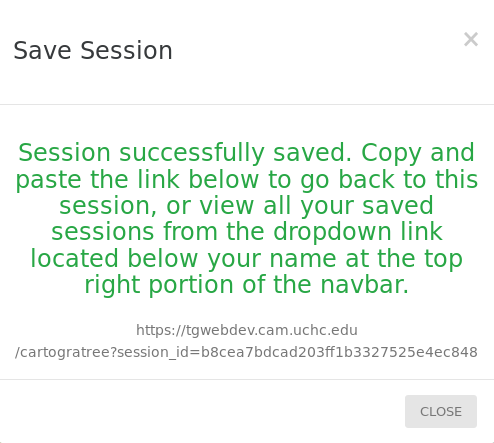
The filters applied, layers activated, trees chosen and current state of the map can be saved to go back to at a later date by clicking the SAVE SESSION button located at the bottom of the left panel. If the save is successful, a popup will appear with a link with a session_id supplied for CartograTree which you can follow at anytime to go back to this state of the map. Verified users that are logged in to their account can also save a session to their account with a title and comment.
4.8. Analyze data
Logged in users have permission to perform landscape genomics analysis. The user can select the dataset to be used, select/deselect specific trees, what publications to include, and which environmental variables to be sent for analysis. In the final stage before confirmation, they will be shown histograms related to the genotypic data associated with each tree and the user can select and filter out data they would like to exclude. The analysis will be performed using Samβada and the user will be notified of the results after the anlysis is done.
4.8.1. Galaxy Workflows
4.8.2. How do I select trees?
When you click on a tree icon on the map, a detailed view pops up to the right of the screen. On the bottom of this map overlay, there is an “Add All” button to add all the trees at this location for analysis, and an “Add Tree” button next to the tree ids to add individual trees.
4.8.3. How do I select environmental data?
You can view environmental layers using the environmental layers panel, then clicking on any point in the map when any of the environmental layers active shows the value at that location for the layers active. For analysis, you can select the environmental variables you want based on the layers active.
4.8.4. How long does it take?
Depends on the size of the dataset you selected. Can be anywhere from a couple hours to days.
4.8.5. How do I know when it’s done?
You’ll receive an email notification.
4.8.6. Example Input
| Name | ENV1 | ENV2 | ENV3 |
|---|---|---|---|
| ID1 | 46 | 89 | 99 |
| ID2 | 10 | 2 | 77 |
| ID1 | 46 | 89 | 99 |
| ID2 | 10 | 2 | 77 |
| ID1 | 46 | 89 | 99 |
| ID2 | 10 | 2 | 77 |